General observation
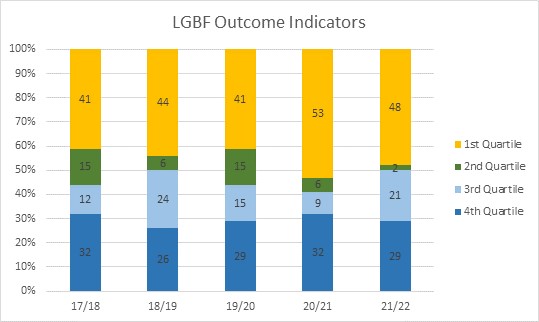
Performance data at local and national levels would indicate that the Council is continuing to deliver high quality services that are appreciated by the people of Shetland. Full data for 2022-23 is not yet available at a national level, however the table below shows Shetland’s national ranking against various indicators, as well as how performance has changed over time. The following graph shows that 48% of our LGBF indicators are in the top quartile, a slight reduction from the year before, but an increase on 2019-20. Data on staff and user satisfaction, highlighted throughout this report, also helps to show that the services the Council provides are appreciated.
Our Ambition was meant to help the Council take a more proactive approach to the challenges we face, understanding the things that drive change and helping us find ways to mitigate or manage them. This performance report helps to show how much continues to be done across services to seek to achieve the plan’s vision of creating a positive, confident and sustainable future for Shetland.
|
Indicator |
SIC Latest |
SIC Rank |
Change in time Shetland |
Change in Time Scotland |
Other LAs |
|---|---|---|---|---|---|
|
Local Schools |
86.7 |
4th |
-1.6 |
-3.5 |
56%-88% |
|
Libraries |
88.7 |
2nd |
+0.1 |
-3.0 |
58%-91% |
|
Parks & Open Spaces |
93.1 |
2nd |
-0.2 |
-0.1 |
51%-94% |
|
Museums & Galleries |
92.6 |
1st |
-0.4 |
-2.7 |
93%-48% |
|
Leisure Facilities |
90.3 |
1st |
-2.0 |
-2.2 |
90%-46% |
|
Refuse Collection |
87.3 |
5th |
-6.0 |
-7.7 |
60%-90% |
|
Street Cleaning |
74.1 |
3rd |
-0.7 |
-13.7 |
48%-79% |
|
Adults supported at home who agree that their services and support had an impact in improving or maintaining their quality of life |
93.6 |
1st |
+10.0 |
-5.9 |
63%-94% |
|
Adults supported at home who agree that they are supported to live as independently as possible |
89.8 |
2nd |
+15.2 |
-3.9 |
70%-90% |
|
Adults supported at home who agree that they had a say in how their help, care or support was provided |
77.9 |
2nd |
0.0 |
-8.2 |
61%-81% |
|
Carers who feel supported to continue in their caring role |
44.6 |
1st
|
-6.6 |
-10.3 |
24%-45% |

Local Government Benchmarking Framework Outcome Indicators
